Summary
Figures are for students aged 15 or 16 who were in their final year of statutory education, Year 11 in mainstream and special schools during the 2019-20 academic year. The survey, providing the destination of these pupils on the 31st October 2020 was in respect of 30,811 pupils that is the 2020 Year 11 destinations cohort.
- 51.1% (15,756 individuals) were male and 48.8% (15,039 individuals) were female. 16 pupils (0.05%) identified themselves as ‘Other’
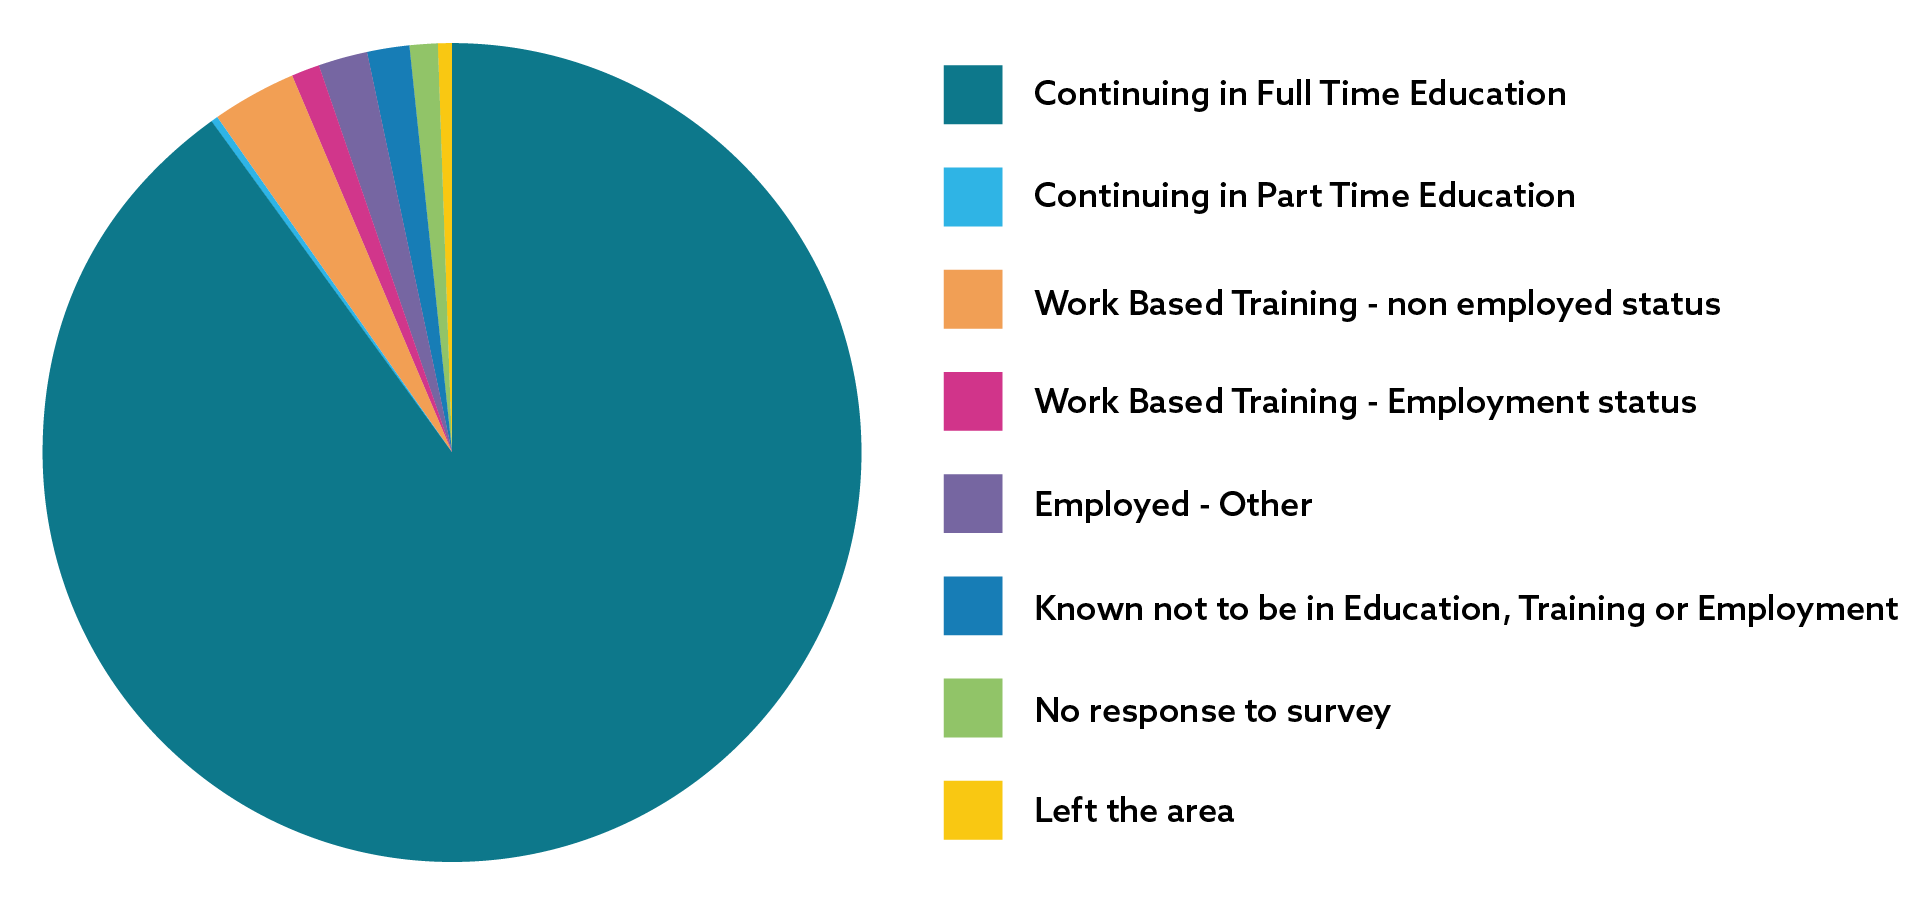
- Most of the cohort, 94.9% (29,245 individuals) went into some form of continued learning in full time education, part time education (16 hours or less a week) or work-based training. This represented 93.6% of males, 96.4% of female pupils and 68.8% of pupils in the Other category
- The greatest proportion of the cohort, 90.4 % (27,863 individuals) continued in full time education
- 54.8% continued at a further education college (15,259 individuals) and 45.2% of those continuing in full time education (12,604 individuals) continued their education in school
- A higher proportion of males (7.2 percentage points more than females) chose to continue their education at further education college
- A higher proportion of females (7.2 percentage points more than males) chose to remain in school
- 6.4% of the cohort (1,964 individuals) entered the labour market, either going into employment or work-based training. More males than females chose to enter the labour market, a differential of 3.3 percentage points (8% males compared to 4.7% females)
- 3.1% (964 individuals) entered work-based training non-employed status
- 1.3% of the cohort (393 individuals) entered work-based training with employed status. A higher proportion of males (2.0%) than females (0.5%) were in this category (a difference of 1.5 percentage points)
- 2% (607 individuals) entered employment outside Government supported funding. More males than females chose this route; a 1.7 percentage point difference
- On the survey date, 1.7% of the cohort (527 individuals), were known not to be in any form of education, training, or employment (NEET). Males accounted for 60% of the total (316 individuals) compared to females at 39.5% (208 individuals). This represents a 20.5 percentage point differential between females and males
- 38.1% (201 individuals) of those known not to be NEET were able to enter employment, education, or training (EET) (as opposed to the 326 (61.9%) individuals who were unable to enter EET due to illness, pregnancy, and other reasons)
- There was no response to the survey from 0.9% of the cohort (263 individuals)
- 0.5% (169 individuals), were shown to have left their local area
Year 11 Overall Figures
| Male | % | Female | % | Other | % | Total | % | |
|---|---|---|---|---|---|---|---|---|
| Continuing in Full Time Education | 13912 | 88.3 | 13940 | 92.7 | 11 | 68.8 | 27863 | 90.4 |
| Continuing in Part Time Education (less than 16 hours a week) | 17 | 0.1 | 8 | 0.1 | 0 | 0.0 | 25 | 0.1 |
| Work Based Training - Non Employed Status | 492 | 3.1 | 472 | 3.1 | 0 | 0.0 | 964 | 3.1 |
| Work Based Training - Employment Status | 320 | 2.0 | 73 | 0.5 | 0 | 0.0 | 393 | 1.3 |
| Employed - Other | 444 | 2.8 | 163 | 1.1 | 0 | 0.0 | 607 | 2.0 |
| Known Not To Be In Education, Employment or Training | 316 | 2.0 | 208 | 1.4 | 3 | 18.8 | 527 | 1.7 |
| No Response to Survey | 161 | 1.0 | 100 | 0.7 | 2 | 12.5 | 263 | 0.9 |
| Left the Area | 94 | 0.6 | 75 | 0.5 | 0 | 0.0 | 169 | 0.5 |
| Total Number in cohort | 15756 | 100.0 | 15039 | 100.0 | 16 | 100.0 | 30811 | 100.0 |
Full Time Education (FTE)
| Male | % | Female | % | Other | % | Total | % | |
|---|---|---|---|---|---|---|---|---|
| Continuing to Year 12 in School | 5790 | 41.6 | 6809 | 48.8 | 5 | 45.5 | 12604 | 45.2 |
| Continuing to Year 12 in Colleges of Further Education | 8122 | 58.4 | 7131 | 51.2 | 6 | 54.5 | 15259 | 54.8 |
| Total | 13912 | 100 | 13940 | 100 | 11 | 100 | 27863 | 100 |
Not in Employment, FTE and Training
| Male | % | Female | % | Other | % | Total | % | |
|---|---|---|---|---|---|---|---|---|
| Able to enter Employment, Education or WBTYP | 122 | 38.6 | 79 | 38.0 | 0 | 0.0 | 201 | 38.1 |
| Unable to enter Employment, Education or WBTYP due to illness, pregnancy and other reasons | 194 | 61.4 | 129 | 62.0 | 3 | 100.0 | 326 | 61.9 |
| Total | 316 | 100.0 | 208 | 100.0 | 3 | 100.0 | 527 | 100.0 |
Ethnicity
Of those returning information on ethnicity from ethnic minority backgrounds the most popular choice of route across all minority ethnic groups was continuing in full time education at 94.8% (compared with 90.1% for those from white backgrounds).
A higher percentage of those with white backgrounds went into the various labour market categories (6.8%) compared to those from minority ethnic backgrounds (2.2%).
A higher proportion of young people who were NEET came from white backgrounds (1.8% or 446 individuals) compared to individuals from an ethnic minority (0.9% or 17 individuals).
| White | % | Minority Ethnic Groups | % | No information on ethnicity | % | Total | % | |
|---|---|---|---|---|---|---|---|---|
| Continuing in Full Time Education (Schools and Colleges) | 22401 | 90.1 | 1828 | 94.8 | 3634 | 90.7 | 27863 | 90.4 |
| Continuing in Part Time Education (Less than 16 hours a week) | 20 | 0.1 | 1 | 0.1 | 4 | 0.1 | 25 | 0.1 |
| Work Based Training - Non Employed Status | 850 | 3.4 | 24 | 1.2 | 90 | 2.2 | 964 | 3.1 |
| Work Based Training - Employment Status | 343 | 1.4 | 6 | 0.3 | 44 | 1.1 | 393 | 1.3 |
| Employed - Other | 497 | 2.0 | 12 | 0.6 | 98 | 2.4 | 607 | 2.0 |
| Known Not To Be In Education, Employment or Training | 446 | 1.8 | 17 | 0.9 | 64 | 1.6 | 527 | 1.7 |
| Unknown | 212 | 0.9 | 15 | 0.8 | 36 | 0.9 | 263 | 0.9 |
| Left the Area | 106 | 0.4 | 25 | 1.3 | 38 | 0.9 | 169 | 0.5 |
| Total Number in Cohort | 24875 | 100.0 | 1928 | 100.0 | 4008 | 100.0 | 30811 | 100.0 |
| % of Total Cohort | 80.7 | 6.3 | 13.0 | 100 |
View other year groups

View the overall figures of Year 12 pupil destinations from schools in Wales 2020.

View the overall figures of Year 13 pupil destinations from schools in Wales 2020.