Summary
Figures are for students aged 16 or 17 who were in the first year of a school sixth form. The survey, providing the destination of these pupils on the 31st of October 2022, was in respect of 12,086 pupils.
- 47.4% (5,726 individuals) were male and 52.6% (6,360) individuals) were female. No pupils identified themselves as other
- The majority of the cohort, 95.8% (11,574 individuals) went into some form of continued learning in full time education (FTE), part time education (16 hours or less a week) or work-based training. This represented 95.5% of male and 96.0% of female pupils
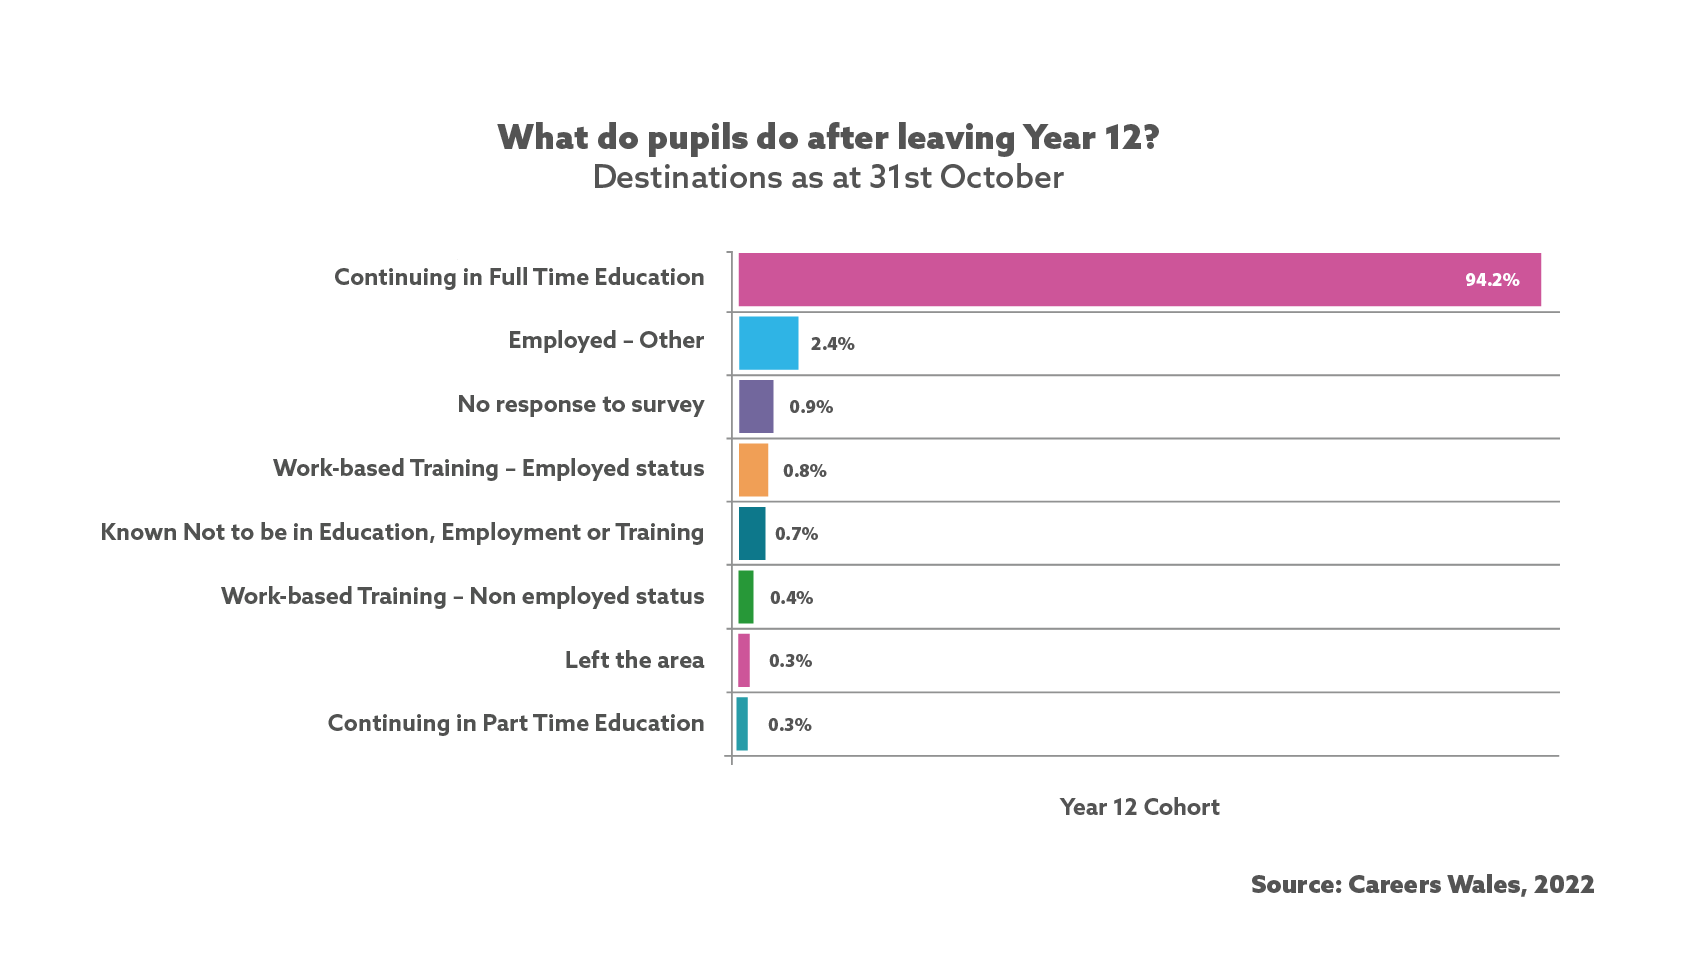
- The greatest proportion of the cohort, 94.2 % (11,388 individuals) continued in full time education
- 91.7% of those continuing in FTE (10,442 individuals) continued their education in school and 8.2% continued at a further education college (938 individuals)
- A higher proportion of males (9%) chose to continue their education at colleges of further education than females (7.6%)
- A higher proportion of females (92.4%) chose to continue to Year 13 in school than males (90.9%)
- 3.5% of the cohort (429 individuals) entered the labour market, either going into employment or work-based training. More males than females chose to enter the labour market (4.0% males and 3.1% females)
- 0.4% (44 individuals) entered work-based training non-employed status
- 0.8% of the cohort (100 individuals) entered work-based training with employed status. A higher proportion of males (1.1%) than females (0.6%) were in this category
- 2.4% (285 individuals) entered employment outside Government supported funding; males 2.5% (142 individuals) and females 2.2% (143 individuals)
- On the survey date, 0.7% of the cohort (80 individuals), were known not to be in any form of education, training, or employment (NEET). Males accounted for 47.5% of the total (38 individuals) compared to females at 52.5% (42 individuals)
- 41.3% (33 individuals) of those known to be NEET were able to enter employment, education, or training (EET)
- 58.8% of those known to be NEET (47 individuals) were unable to enter EET due to illness, pregnancy, or other reasons
- There was no response to the survey from 0.9% of the cohort (114 individuals)
- 0.3% (33 individuals), were shown to have left their local area
Year 12 Overall Figures
| Status | Male | % | Female | % | Other | % | Total | % |
|---|---|---|---|---|---|---|---|---|
| Continuing in Full Time Education | 5,355 | 93.5 | 6,033 | 94.9 | 0 | 0.0 | 11,388 | 94.2 |
| Continuing in Part Time Education (less than 16 hours a week) | 28 | 0.5 | 14 | 0.2 | 0 | 0.0 | 42 | 0.3 |
| Work Based Training - Non employed status | 26 | 0.5 | 18 | 0.3 | 0 | 0.0 | 44 | 0.4 |
| Work Based Training - Employed status | 61 | 1.1 | 39 | 0.6 | 0 | 0.0 | 100 | 0.8 |
| Employed - Other | 142 | 2.5 | 143 | 2.2 | 0 | 0.0 | 285 | 2.4 |
| Known Not To Be In Education, Employment or Training | 38 | 0.7 | 42 | 0.7 | 0 | 0.0 | 80 | 0.7 |
| No response to survey | 56 | 1.0 | 58 | 0.9 | 0 | 0.0 | 114 | 0.9 |
| Left the area | 20 | 0.3 | 13 | 0.2 | 0 | 0.0 | 33 | 0.3 |
| Total number in cohort | 5,726 | 100 | 6,360 | 100 | 0 | 0 | 12,086 | 100 |
Full Time Education (FTE)
| Gender | Percentage of students who stayed in Full Time Education |
|---|---|
| Male | 93.5% |
| Female | 94.9% |
| Status | Male | % | Female | % | Other | % | Total | % |
|---|---|---|---|---|---|---|---|---|
| Continuing to Year 13 in School | 4,869 | 90.9 | 5,573 | 92.4 | 0 | 0.0 | 10,442 | 91.7 |
| Continuing to Year 13 in colleges of further education | 482 | 9.0 | 456 | 7.6 | 0 | 0.0 | 938 | 8.2 |
| Year 12 continuing in Higher Education | 4 | 0.1 | 3 | 0.0 | 0 | 0.0 | 7 | 0.1 |
| Year 12 taking gap year with intention of going to Higher Education | 0 | 0.0 | 1 | 0.0 | 0 | 0.0 | 1 | 0.0 |
| Total | 5,355 | 100 | 6,033 | 100 | 0 | 0 | 11,388 | 100 |
Known Not To Be In Education, Employment, or Training (NEET)
| Status | Male | % | Female | % | Other | % | Total | % |
|---|---|---|---|---|---|---|---|---|
| Able to enter Employment, Education or WBTYP | 19 | 50.0 | 14 | 33.3 | 0 | 0.0 | 33 | 41.3 |
| Unable to enter Employment, Education or WBTYP due to illness, pregnancy and other reasons | 19 | 50.0 | 28 | 66.7 | 0 | 0.0 | 47 | 58.8 |
| Total | 38 | 100 | 42 | 100 | 0 | 0 | 80 | 100 |
Ethnicity
Of those returning information on ethnicity:
- The most popular choice of route across all minority ethnic groups was continuing in FTE at 95.4%. This is higher than the proportion for those from a white background (94.1%)
- A higher percentage of those from white backgrounds went into the various labour market categories (3.8%) compared to those from minority ethnic backgrounds (2.2%)
- A higher proportion of young people who were NEET came from white backgrounds (0.7% or 70 individuals) compared to individuals from an ethnic minority (0.6% or 8 individuals)
| Status | White | % | Minority Ethnic Groups | % | No information on ethnicity | % | Total | % |
|---|---|---|---|---|---|---|---|---|
| Continuing in Full Time Education (schools and colleges) | 9,991 | 94.1 | 1,209 | 95.4 | 188 | 94.0 | 11,388 | 94.2 |
| Continuing in Part Time Education (less than 16 hours a week) | 36 | 0.3 | 3 | 0.2 | 3 | 1.5 | 42 | 0.3 |
| WBTYP (without employed status) | 34 | 0.3 | 10 | 0.8 | 0 | 0.0 | 44 | 0.4 |
| WBTYP (employed status) | 96 | 0.9 | 4 | 0.3 | 0 | 0.0 | 100 | 0.8 |
| Employment | 271 | 2.6 | 14 | 1.1 | 0 | 0.0 | 285 | 2.4 |
| Known Not To Be In Education, Employment or Training | 70 | 0.7 | 8 | 0.6 | 2 | 1.0 | 80 | 0.7 |
| Unknown | 100 | 0.9 | 12 | 0.9 | 2 | 1.0 | 114 | 0.9 |
| Statutory School leavers who are known to have left the area | 21 | 0.2 | 7 | 0.6 | 5 | 2.5 | 33 | 0.3 |
| Total Number in Cohort | 10,619 | 100 | 1,267 | 100 | 200 | 100 | 12,086 | 100 |
| % of Total Cohort | 87.9 | 10.5 | 1.7 | 100 |
View other year groups
View the overall figures of Year 11 pupil destinations from schools in Wales 2022.

View the overall figures of Year 13 pupil destinations from schools in Wales 2022.