Summary
Figures are for students aged 15 or 16 who were in their final year of statutory education, Year 11, in mainstream and special schools during the 2022-2023 academic year. The survey, providing the destination of these pupils on 31 October 2023, was in respect of 33,110 pupils who left compulsory education in 2023.
- 51.1% (16,932 individuals) were male and 48.8% (16,172 individuals) were female
- Most of the cohort, 93.0% (30,803 individuals) went into some form of continued learning in full time education, part time education (16 hours or less a week) or work-based training. This represented 91.9% of males and 94.2% of female pupils
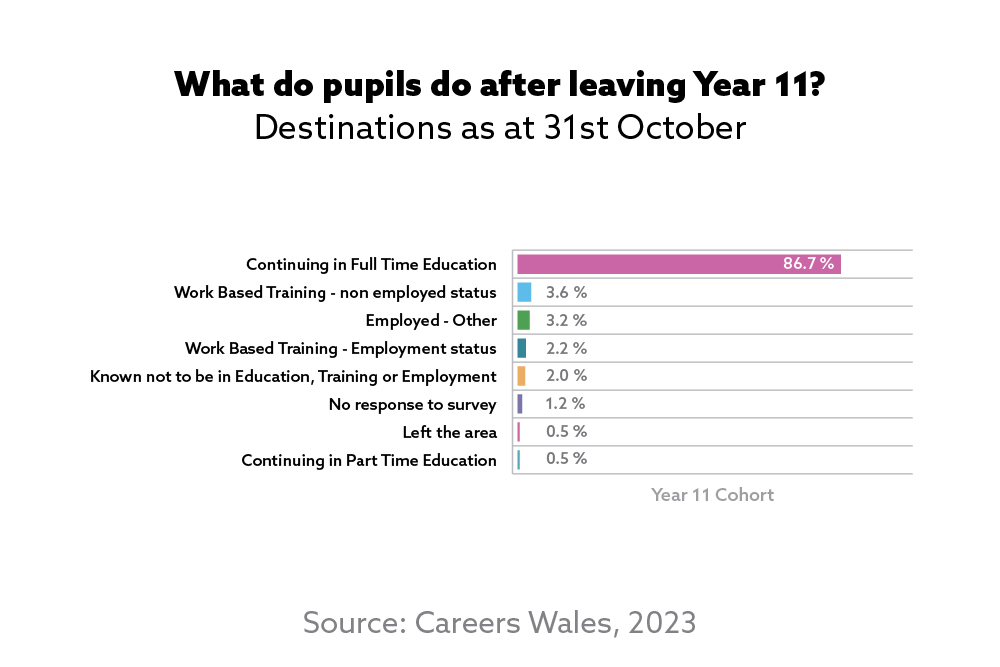
- The greatest proportion of the cohort, 86.7% (28,714 individuals) continued in full time education (FTE)
- Of those continuing in FTE, 60.8% continued at a further education college (17,458 individuals) and 39.2% (11,256 individuals) continued their education in school
- A higher proportion of males (3.2 percentage points more than females) chose to continue their education at further education college
- A higher proportion of females (3.2 percentage points more than males) chose to remain in school
- 9.0% of the cohort (2,996 individuals) entered the labour market, either going into employment or work-based training. More males than females chose to enter the labour market (10.7% males compared to 7.3% females)
- 3.6% (1,205 individuals) entered work-based training non-employed status
- 2.2% of the cohort (725 individuals) entered work-based training with employed status. A higher proportion of males (3.1%) than females (1.2%) were in this category
- 3.2% (1,066 individuals) entered employment outside Government supported funding. More males (4.0%) than females (2.4%) chose this route
- On the survey date, 2.0% of the cohort (670 individuals) were known not to be in any form of education, training, or employment (NEET). Males accounted for 52.1% of the total (349 individuals) compared to females at 47.9% (321 individuals)
- 34.5% (231 individuals) of those NEET were able to enter employment, education, or training (EET) as opposed to the 65.5% (439 individuals) who were unable to enter EET due to illness, pregnancy, or other reasons
- There was no response to the survey from 1.2% of the cohort (398 individuals)
- 0.5% (173 individuals) were shown to have left their local area
Year 11 Overall Figures
| Status | Male | % | Female | % | Other | % | Total | % |
|---|---|---|---|---|---|---|---|---|
| Continuing in Full Time Education | 14,322 | 84.6 | 14,386 | 89.0 | 6 | 100 | 28,714 | 86.7 |
| Continuing in Part Time Education (less than 16 hours a week) | 110 | 0.6 | 49 | 0.3 | 0 | 0 | 159 | 0.5 |
| Work Based Training - Non Employed Status | 607 | 3.6 | 598 | 3.7 | 0 | 0 | 1,205 | 3.6 |
| Work Based Training - Employed Status | 527 | 3.1 | 198 | 1.2 | 0 | 0 | 725 | 2.2 |
| Employed - Other | 676 | 4.0 | 390 | 2.4 | 0 | 0 | 1,066 | 3.2 |
| Known Not To Be In Education, Employment or Training | 349 | 2.1 | 321 | 2.0 | 0 | 0 | 670 | 2.0 |
| No Response to Survey | 244 | 1.4 | 154 | 1.0 | 0 | 0 | 398 | 1.2 |
| Left the Area | 97 | 0.6 | 76 | 0.5 | 0 | 0 | 173 | 0.5 |
| Total Number in cohort | 16,932 | 100 | 16,172 | 100 | 6 | 100 | 33,110 | 100 |
Full Time Education (FTE)
| Gender | Percentage of students who stayed in Full Time Education |
|---|---|
| Male | 84.6% |
| Female | 89.0% |
| Status | Male | % | Female | % | Other | % | Total | % |
|---|---|---|---|---|---|---|---|---|
| Continuing to Year 12 in School | 5,385 | 37.6 | 5,871 | 40.8 | 0 | 0.0 | 11,256 | 39.2 |
| Continuing to Year 12 in Colleges of Further Education | 8,937 | 62.4 | 8,515 | 59.2 | 6 | 100 | 17,458 | 60.8 |
| Total | 14,322 | 100 | 14,386 | 100 | 6 | 100 | 28,714 | 100 |
Known Not To Be In Education, Employment or Training (NEET)
| Status | Male | % | Female | % | Other | % | Total | % |
|---|---|---|---|---|---|---|---|---|
| Able to enter Employment, Education or WBTYP | 138 | 39.5 | 93 | 29.0 | 0 | 0 | 231 | 34.5 |
| Unable to enter Employment, Education or WBTYP due to illness, pregnancy and other reasons | 211 | 60.5 | 228 | 71.0 | 0 | 0 | 439 | 65.5 |
| Total | 349 | 100 | 321 | 100 | 0 | 0 | 670 | 100 |
Ethnicity
Of those returning information on ethnicity from ethnic minority backgrounds:
- The most popular choice of route across all minority ethnic groups was continuing in FTE at 92.6% (compared with 86.2% for those from white backgrounds)
- A higher percentage of those with white backgrounds went into the various labour market categories (9.6%) compared to those from minority ethnic backgrounds (3.6%)
- A higher proportion of young people who were NEET came from white backgrounds (2.1% or 642 individuals) compared to individuals from an ethnic minority (0.9% or 23 individuals)
| Status | White | % | Minority Ethnic Groups | % | No information on ethnicity | % | Total | % |
|---|---|---|---|---|---|---|---|---|
| Continuing in Full Time Education (Schools and Colleges) | 25,977 | 86.2 | 2,360 | 92.6 | 377 | 88.9 | 28,714 | 86.7 |
| Continuing in Part Time Education (Less than 16 hours a week) | 150 | 0.5 | 5 | 0.2 | 4 | 0.9 | 159 | 0.5 |
| WBTYP (without employed status) | 1,145 | 3.8 | 49 | 1.9 | 11 | 2.6 | 1,205 | 3.6 |
| WBTYP (employed status) | 707 | 2.3 | 14 | 0.5 | 4 | 0.9 | 725 | 2.2 |
| Employment | 1,031 | 3.4 | 28 | 1.1 | 7 | 1.7 | 1,066 | 3.2 |
| Known Not To Be In Education, Employment or Training | 642 | 2.1 | 23 | 0.9 | 5 | 1.2 | 670 | 2.0 |
| Unknown | 366 | 1.2 | 26 | 1.0 | 6 | 1.4 | 398 | 1.2 |
| Statutory School leavers who are known to have left the area | 120 | 0.4 | 43 | 1.7 | 10 | 2.4 | 173 | 0.5 |
| Total Number in Cohort | 30,138 | 100 | 2,548 | 100 | 424 | 100 | 33,110 | 100 |
| % of Total Cohort |
| 91.0 |
| 7.7 |
| 1.3 |
| 100 |
View other year groups

View the overall figures of Year 12 pupil destinations from schools in Wales 2023.

View the overall figures of Year 13 pupil destinations from schools in Wales 2023.