Summary
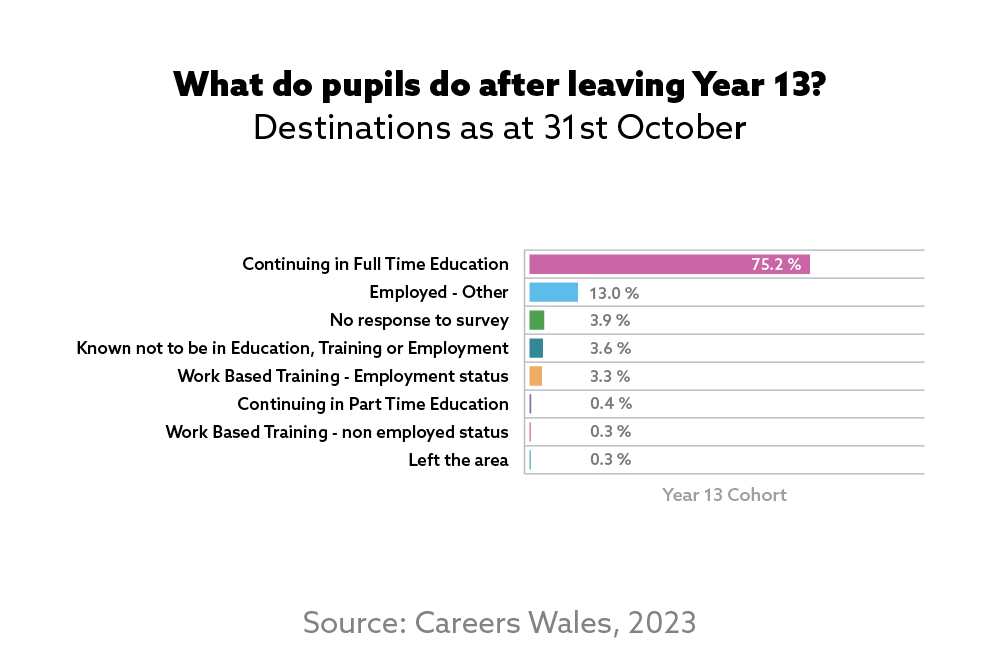
Figures are for students aged 17 or 18 in the second year of a school sixth form. The survey, providing the destination of these pupils on 31 October 2023, was in respect of 10,383 pupils completing Year 13 in 2023.
- 47.2% were male and 52.8% were female
- 79.2% of the cohort (8,228 individuals) went into some form of continued learning in education or work-based training. A higher proportion of the total female cohort were in this category (81.9%) compared to males (76.3%)
- 75.2% of the cohort (7,813 individuals) continued in full time education (FTE). Of those 85.3% (6,665 individuals) progressed directly to higher education. This represented 64.2% of the total cohort
- 70.2% of the total female cohort progressed directly to higher education and 57.5% of the total male cohort
- Of those continuing within FTE a lower percentage 5.7% (448 individuals) continued their education in school compared to 7.9% (619 individuals) who continued at a further education college
- 1.0% (81 individuals) of those continuing in education stated that they were taking a gap year with the intention of going on to higher education the following year
- Continuing in part time education (16 hours or less per week) was the route taken by 40 individuals (0.4%)
- 16.6% (1,721 individuals) entered the labour market, either going into employment or work-based training
- 13.0% (1,346 individuals) entered employment outside of Government supported training, 14.6% of males (713 individuals) and 11.5% of females (633 individuals)
- A small proportion of the cohort 0.3% (30 individuals) entered work-based training without employed status
- 3.3% (345 individuals) entered work-based learning with employed status. A higher percentage of males (5.1%) than females (1.8%) took this route
- On the survey date, 3.6% (375 individuals) of the cohort were known not to be in any form of education, training, or employment (NEET). A higher percentage of males 4.8% (235 individuals) than females 2.6% (140 individuals) were in this category
- 0.3% (26 individuals) of the cohort were shown to have left their local area
Year 13 Overall Figures
| Status | Male | % | Female | % | Other | % | Total | % |
|---|---|---|---|---|---|---|---|---|
| Continuing in Full Time Education | 3,448 | 70.4 | 4,365 | 79.6 | 0 | 0 | 7,813 | 75.2 |
| Continuing in Part Time Education (less than 16 hours a week) | 24 | 0.5 | 16 | 0.3 | 0 | 0 | 40 | 0.4 |
| Work Based Training - Non employed status | 15 | 0.3 | 15 | 0.3 | 0 | 0 | 30 | 0.3 |
| Work Based Training - Employed status | 248 | 5.1 | 97 | 1.8 | 0 | 0 | 345 | 3.3 |
| Employed - Other | 713 | 14.6 | 633 | 11.5 | 0 | 0 | 1,346 | 13.0 |
| Known Not To Be In Education, Employment or Training | 235 | 4.8 | 140 | 2.6 | 0 | 0 | 375 | 3.6 |
| No response to survey | 202 | 4.1 | 206 | 3.8 | 0 | 0 | 408 | 3.9 |
| Left the area | 13 | 0.3 | 13 | 0.2 | 0 | 0 | 26 | 0.3 |
| Total number in cohort | 4,898 | 100 | 5,485 | 100 | 0 | 0 | 10,383 | 100 |
Full Time Education (FTE)
| Gender | Percentage of students who stayed in Full Time Education |
|---|---|
| Male | 70.4% |
| Female | 79.6% |
| Status | Male | % | Female | % | Other | % | Total | % |
|---|---|---|---|---|---|---|---|---|
| Continuing to Year 14 in School of 11-18 schools | 257 | 7.5 | 191 | 4.4 | 0 | 0 | 448 | 5.7 |
| Year 13 school leavers continuing to colleges of Further Education | 347 | 10.1 | 272 | 6.2 | 0 | 0 | 619 | 7.9 |
| Year 13 continuing in Higher Education | 2,815 | 81.6 | 3,850 | 88.2 | 0 | 0 | 6,665 | 85.3 |
| Year 13 taking gap year with intention of going to Higher Education | 29 | 0.8 | 52 | 1.2 | 0 | 0 | 81 | 1.0 |
| Total | 3,448 | 100 | 4,365 | 100 | 0 | 0 | 7,813 | 100 |
Known Not To Be In Education, Employment or Training (NEET)
| Status | Male | % | Female | % | Other | % | Total | % |
|---|---|---|---|---|---|---|---|---|
| Able to enter Employment, Education or WBTYP | 97 | 41.3 | 46 | 32.9 | 0 | 0 | 143 | 38.1 |
| Unable to enter Employment, Education or WBTYP due to illness, pregnancy and other reasons | 138 | 58.7 | 94 | 67.1 | 0 | 0 | 232 | 61.9 |
| Total | 235 | 100 | 140 | 100 | 0 | 0 | 375 | 100 |
Ethnicity
Of those returning information on ethnicity:
- The most popular choice of route across all minority ethnic groups was continuing in FTE at 83.8%. This compared to 74.2% for individuals from a white background
- A higher percentage of those with white backgrounds entered employment outside of Government sponsored training (13.8% of those from a white background compared to 5.5% of those from a minority ethnic background)
- A higher percentage of those with white backgrounds entered work-based training–employed status (3.4% of those from a white background compared to 2.7% of those from a minority ethnic background)
- The proportion of young people from a white background who were NEET was higher than that for those from a minority ethnic background (3.7% compared to 2.6%). This represents 344 individuals from a white background and 27 individuals from a minority ethnic background.
| Status | White | % | Minority Ethnic Groups | % | No information on ethnicity | % | Total | % |
|---|---|---|---|---|---|---|---|---|
| Continuing in FT Education (schools and colleges) | 6,851 | 74.2 | 868 | 83.8 | 94 | 79.0 | 7,813 | 75.2 |
| Continuing in Part Time Education (less than 16 hours a week) | 36 | 0.4 | 4 | 0.4 | 0 | 0.0 | 40 | 0.4 |
| WBTYP (without employed status) | 28 | 0.3 | 2 | 0.2 | 0 | 0.0 | 30 | 0.3 |
| WBTYP (employed status) | 315 | 3.4 | 28 | 2.7 | 2 | 1.7 | 345 | 3.3 |
| Employment | 1278 | 13.8 | 57 | 5.5 | 11 | 9.2 | 1,346 | 13.0 |
| Known Not To Be In Education, Employment or Training | 344 | 3.7 | 27 | 2.6 | 4 | 3.4 | 375 | 3.6 |
| Unknown | 356 | 3.9 | 45 | 4.3 | 7 | 5.9 | 408 | 3.9 |
| Statutory School leavers who are known to have left the area | 20 | 0.2 | 5 | 0.5 | 1 | 0.8 | 26 | 0.3 |
| Total Number in Cohort | 9,228 | 100 | 1,036 | 100 | 119 | 100 | 10,383 | 100 |
| % of Total Cohort |
| 88.9 |
| 10.0 |
| 1.1 |
| 100 |
View other year groups
View the overall figures of Year 11 pupil destinations from schools in Wales 2023.

View the overall figures of Year 12 pupil destinations from schools in Wales 2023.